Are Interest Rates Creating Giant Reversal Pattern?
US10Y…
-2.63%
Add to/Remove from Watchlist
Add to Watchlist
Add Position
Position added successfully to:
Please name your holdings portfolio
Type:
BUY
SELL
Date:
Amount:
Price
Point Value:
Leverage:
1:1
1:10
1:25
1:50
1:100
1:200
1:400
1:500
1:1000
Commission:
Create New Watchlist
Create
Create a new holdings portfolio
Add
Create
+ Add another position
Close
The past few years have seen extreme volatility in the bond market, equating to similar interest rate fluctuations.
And it all started with the onset of the coronavirus. The initial panic decline in bond yields (interest rates) was followed by a surge that lasted several quarters. And now, once again, we may be seeing another giant reversal.
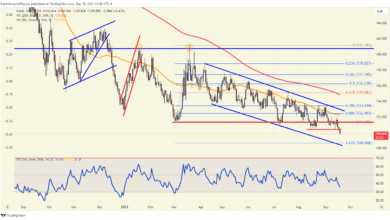
Below is a long-term quarterly chart of the 10-year treasury bond yield. You can see how yields recorded the lowest quarterly close at .68% before staging a huge rally.
 U.S. 10-Year Treasury Bond Yield Quarterly Chart
This quarter, however, bond yields hit dual resistance at the falling trend line and 23% Fibonacci level at (1) and reversed lower.
But this wasn’t any old reversal. The 10-year bond yield could be creating the largest bearish reversal pattern in yield history at (1).
Higher interest rates have rattled the financial markets hard, so a reversal lower is welcome news for consumers and stock market bulls. Stay tuned.