Dow Theory Suggests Caution
DJI
-0.13%
Add to/Remove from Watchlist
Add to Watchlist
Add Position
Position added successfully to:
Please name your holdings portfolio
Type:
BUY
SELL
Date:
Amount:
Price
Point Value:
Leverage:
1:1
1:10
1:25
1:50
1:100
1:200
1:400
1:500
1:1000
Commission:
Create New Watchlist
Create
Create a new holdings portfolio
Add
Create
+ Add another position
Close
DJT
+0.29%
Add to/Remove from Watchlist
Add to Watchlist
Add Position
Position added successfully to:
Please name your holdings portfolio
Type:
BUY
SELL
Date:
Amount:
Price
Point Value:
Leverage:
1:1
1:10
1:25
1:50
1:100
1:200
1:400
1:500
1:1000
Commission:
Create New Watchlist
Create
Create a new holdings portfolio
Add
Create
+ Add another position
Close
- The Dow Jones has sharply outperformed the Transportation Average
- The former is on the cusp of breaking out above its August peak
- The latter is well underneath its summer high
- Technicians can easily spot this bearish non-confirmation as equities rise
The Industrials sector has powered the S&P 500 higher since early October. Much fanfare was made about the Dow Jones Industrial Average notching its best month since 1974, but technicians often like to look under the hood to see what’s driving price action.
The past seven weeks or so have featured blue-chip multinational Industrials soar in price, much of the gains coming from positive earnings reports. Shares of Caterpillar (NYSE:CAT), Boeing (NYSE:BA), Honeywell (NASDAQ:HON), and 3M (NYSE:MMM) have provided years’ worth of gains over a handful of weeks.
S&P 500 Sector Performances Since October 6: Industrials Leading
 S&P Sector Performance
Transports, while up impressively from their October low, are not quite as bullish as large-cap diversified indexes. That reality catches the attention of technicians everywhere. The century-old Dow Theory, among its six tenets, says that price indexes must confirm each other for a healthy trend to be in place. Right now, I see a decoupling between the DJIA and the Dow Transports.
Let’s start with the positive piece—the Dow 30. Notice in the chart below that the DJIA is comfortably above its 200-day moving average and making a run at the August high. The price-weighted index’s chart, with UnitedHealth (NYSE:UNH) as the biggest holding at more than 10%, looks better than so many other areas of the market. The last several sessions have the hallmarks of a bull flag pattern to me, implying the next move will be to the upside. But do the transports confirm that bullish outlook?
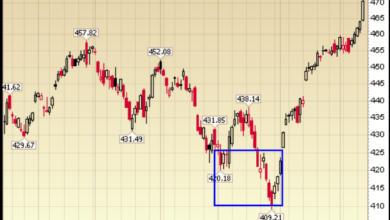
Dow Jones Industrial Average ETF: Above Its 200-DMA, Probing the August High
 DIA Daily
The answer is no. The above Dow Jones Industrial Average SPDR ETF (NYSE:DIA) chart contrasts with the iShares Transportation Average ETF (NYSE:IYT) in that the latter is well below its August high and failed again at rising above its 200-day moving average. Not even lower oil prices lately have helped the transports. Dow Theorists, and technicians more broadly, must monitor the August highs on both of these ETFs. We are in bearish mode, confirming the overall cyclical bear market, until new rebound highs on both the industrials and transports are made.
Dow Jones Transportation ETF: Below Its 200-DMA, Underperforming
 IYT Daily
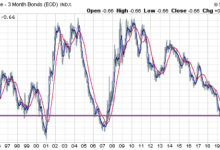
So, the focus is on the transportation average, specifically. We can look for additional clues using historical seasonal patterns. According to Equity Clock, IYT often struggles somewhat against the S&P 500 now through early January. Despite this being a positive time on the calendar for much of the equity market, transports sometimes do not lead the way. They do, however, perform relatively well starting in early January through early May. It is one sign that some volatility could be on the horizon for the broad market which might be the contrarian take.
A Not-So-Cheery Time of Year for IYT Vs. the S&P 500
 IYT Vs. S&P Weekly
The Bottom Line
The Dow Theory waves a caution flag right now as the transportation average is sharply underperforming the DJIA. Bulls want to see alpha out of IYT to help give legs to the current rally.
Disclaimer: