
Is the U.S. Dollar Index Building Strength to Push Gold Prices Lower?
XAU/USD
+0.74%
Add to/Remove from Watchlist
Add to Watchlist
Add Position
Position added successfully to:
Please name your holdings portfolio
Type:
BUY
SELL
Date:
Amount:
Price
Point Value:
Leverage:
1:1
1:10
1:25
1:50
1:100
1:200
1:400
1:500
1:1000
Commission:
Create New Watchlist
Create
Create a new holdings portfolio
Add
Create
+ Add another position
Close
Gold
+0.71%
Add to/Remove from Watchlist
Add to Watchlist
Add Position
Position added successfully to:
Please name your holdings portfolio
Type:
BUY
SELL
Date:
Amount:
Price
Point Value:
Leverage:
1:1
1:10
1:25
1:50
1:100
1:200
1:400
1:500
1:1000
Commission:
Create New Watchlist
Create
Create a new holdings portfolio
Add
Create
+ Add another position
Close
DXY
-0.22%
Add to/Remove from Watchlist
Add to Watchlist
Add Position
Position added successfully to:
Please name your holdings portfolio
Type:
BUY
SELL
Date:
Amount:
Price
Point Value:
Leverage:
1:1
1:10
1:25
1:50
1:100
1:200
1:400
1:500
1:1000
Commission:
Create New Watchlist
Create
Create a new holdings portfolio
Add
Create
+ Add another position
Close
The US dollar index is a key driver of gold prices (apart from real interest rates). How much strength has it shown recently?
In yesterday’s analysis, I compared the current situation in the precious metals to the one in stocks that we saw last year. It appears that the similarity remains up-to-date as gold is up in today’s pre-market trading (at the moment of writing these words).
As you may recall, last year, stocks didn’t decline until the second session of the year. Of course, the history doesn’t have repeat itself to the letter, but I wouldn’t make too much of the upswing in the first few days of the year. Here’s what we wrote about this matter yesterday:
 S&P 500 Daily Chart
Interestingly, stocks started this year with a bearish reversal.
Of course, these are not the reasons for the decline per se – I listed multiple thereof (e.g., rising real interest rates) in my previous analyses.
The other key driver of gold prices (besides real interest rates) is the USD Index, and it just showed strength. U.S. Dollar Weekly Chart
The USDX is down in today’s pre-market trading, but it moved substantially higher yesterday. High enough to make it clear that the very strong support provided by the 2016 and 2020 highs held.
This, in turn, means that another medium-term rally in the USDX is likely to begin any day now – and perhaps it’s already underway.
From the short-term point of view, we only saw a daily rally so far, and this rally is being corrected right now, which means that the USDX is still in preparation mode. U.S. Dollar Daily Chart
Still, the above short-term chart continues to provide us with bullish implications because of the great similarity between the recent action in the USDX itself and the RSI based on it (not to mention the correlation with gold that you can see on the bottom of the above chart) and what happened in mid-2021.
The lengthy bottom was followed by a small breakout at first, and then by a bigger rally. Both gold and silver fell substantially at that time, and it was the start of an even bigger decline in junior mining stocks.
What we saw yesterday was perhaps analogous to that small breakout that started it all previously.
 Gold Daily Chart
The gold price itself moved to its 50% Fibonacci retracement level, and then moved back down. It reversed on an intraday basis on relatively big volume. It didn’t erase most of the rally, so the bearish indications from the reversal candlestick are not strong. However, the fact that gold moved to one of its key retracements is notable.
In today’s pre-market trading, gold futures moved a bit above that level, but the breakout is not yet confirmed. Silver Daily Chart
Silver reversed in a much more profound and clear manner. In silver’s case, the reversal was clear, and it was confirmed by relatively big volume. This is a bearish indication for the short term.
In today’s pre-market trading silver moved a bit higher, but it didn’t manage to move above yesterday’s intraday highs.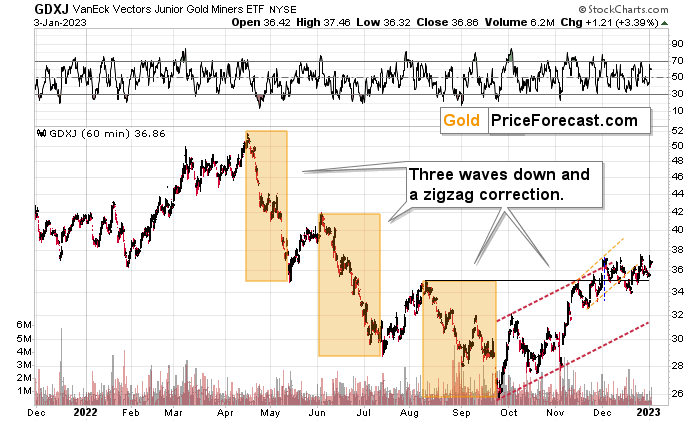 Chart, histogramDescription automatically generated
VanEck Junior Gold Miners ETF (NYSE:GDXJ) moved very close to their previous highs, but then reversed and ended the day visibly below them.
Consequently, nothing really changed, and the overall shape of yesterday’s session was bearish – as it’s the case with daily reversals.
All in all, the short-term outlook for the precious metals didn’t really improve and it remains bearish for the following weeks.
* * * * *


