
Italy Jan EU-harmonised CPI eases to 10.9% y/y, slightly below forecast
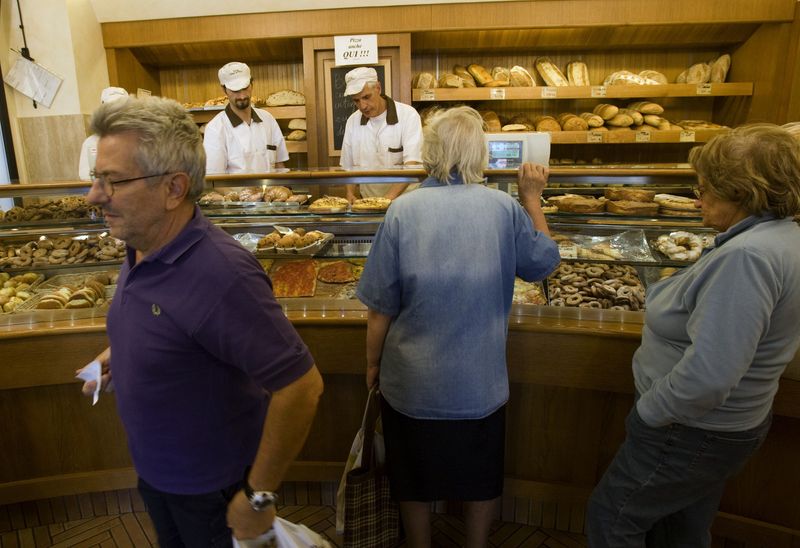
FILE PHOTO: People wait to buy bread in a bakery in downtown Rome September 18, 2008. Consumer groups tried on Thursday to persuade Italians not to buy bread for a day, and to cut down on their consumption of other goods and services, to protest at price
EGOV
0.00%
Add to/Remove from Watchlist
Add to Watchlist
Add Position
Position added successfully to:
Please name your holdings portfolio
Type:
BUY
SELL
Date:
Amount:
Price
Point Value:
Leverage:
1:1
1:10
1:25
1:50
1:100
1:200
1:400
1:500
1:1000
Commission:
Create New Watchlist
Create
Create a new holdings portfolio
Add
Create
+ Add another position
Close
Feb 1 (Reuters) — Italian EU-harmonised consumer prices (HICP) fell a preliminary 1.3% month-on-month in January, with annual inflation slowing to 10.9% from 12.3% in December, data showed on Wednesday.
The 10.9% annual rate was the lowest since September.
The HICP year-on-year rate was marginally below a median forecast of 11.0% in a Reuters survey of 14 analysts.
Official statistics agency ISTAT also reported that the main domestic price index (NIC (NASDAQ:EGOV)), was up 0.2% on the month and up 10.1% annually in January, following an 11.6% annual rate in December.
The lower month-on-month reading for the HICP was due to the impact of new year discount sales for clothes and footwear. The NIC index excludes temporary discounts.
Core inflation (net of fresh food and energy) was running at 6.8% year-on-year on the HICP index in January, up from 6.5% in December.
ISTAT gave the following preliminary breakdown:
EU-harmonised index (HICP):
JAN DEC NOV
Monthly change -1.3 0.2 0.7
Yr/yr inflation 10.9 12.3 12.6
Index (base 2015=100) 119.5 121.1 120.8
The NIC index:
Monthly change 0.2 0.3 0.5
Yr-on-yr inflation 10.1 11.6 11.8
Index (base 2015=100) 119.2 119.0 118.7
ISTAT gave the following sector-by-sector breakdown for the HICP in January:
Sector m/m yr/yr
Food 1.1 12.8
Alcoholic drinks, tobacco 1.0 2.5
Clothing -17.3 8.7
Housing, electricity, fuel -4.7 35.1
Domestic goods 0.5 8.0
Health spending 0.7 2.0
Transport 0.8 7.4
Communications 0.6 -0.6
Recreation 0.2 4.0
Education 0.0 0.7
Hotels, restaurants 0.7 7.2
Other goods, services 0.3 4.1
((Gavin Jones, Rome newsroom gavin.jones@thomsonreuters.com))

