NASDAQ Teetering On Important Fibonacci Price Support
IXIC
+1.28%
Add to/Remove from Watchlist
Add to Watchlist
Add Position
Position added successfully to:
Please name your holdings portfolio
Type:
BUY
SELL
Date:
Amount:
Price
Point Value:
Leverage:
1:1
1:10
1:25
1:50
1:100
1:200
1:400
1:500
1:1000
Commission:
Create New Watchlist
Create
Create a new holdings portfolio
Add
Create
+ Add another position
Close
Technology has become a durable and leading global economy and stock market sector.
And due to a concoction of mixed economic data, overheated inflation, and rising interest rates, technology stocks have been caught in the cross-hairs of a bear market.
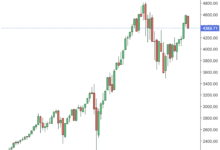
The chart below looks at the NASDAQ Composite on a long-term, monthly timeframe with key Fibonacci levels. NASDAQ Composite Monthly Chart
As you can see, the NASDAQ rallied as high as the 423% Fibonacci extension level before reversing lower. That reversal has sent the NASDAQ sputtering down to an important/strong price support level at the 261% Fibonacci level (10,400).
this key Fibonacci support level fails to hold, prices could fall considerably. The next Fibonacci support level is at the 161% level, near $7,000.
In my humble opinion, tech stocks are at a critical crossroads. Stay tuned.