Why the Bond Market Is Becoming More Volatile
US10Y…
-0.62%
Add to/Remove from Watchlist
Add to Watchlist
Add Position
Position added successfully to:
Please name your holdings portfolio
Type:
BUY
SELL
Date:
Amount:
Price
Point Value:
Leverage:
1:1
1:10
1:25
1:50
1:100
1:200
1:400
1:500
1:1000
Commission:
Create New Watchlist
Create
Create a new holdings portfolio
Add
Create
+ Add another position
Close
Last month we looked at how stock market volatility ebbs and flowsHow Monitoring Volatility Regimes Helps Anticipate Key Market Pivots through time. Let’s pick up this thread and do the same for the bond market, based on the 10-year US Treasury yield.
As with equities, bonds go through periods of low vol, which gives way to vol spikes. But in comparison with stocks, the low-vol episodes are more erratic and less prone to long runs. The longest period of volatility for the 10-year Note since the early 1970s is a 1000-day-plus period in the early 1990s – roughly half as long as the longest run of relative calm for stocks.
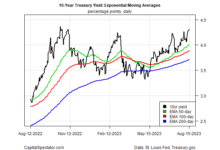
Once again I’m defining volatility as the 30-day standard deviation (annualized) for the rolling one-year change, which in this case is the year-over-year change in the 10-year yield. That calculus is applied to rolling 10-year windows. Reviewing history on this basis reveals a striking fact: the bond market has become substantially more volatile lately, in absolute and relative terms.
 10-Yr Treasury Yield Rolling 30-Day Return Volatility
The next graph shows the running sequence of days when vol is below Z-scores of 1, a proxy for identifying low-volatility regimes. Not surprisingly, low-vol episodes of more than trivial lengths have been a rare bird lately, courtesy of the Federal Reserve’s interest-rate hikes over the past year. As the market has struggled to discern how long and how far the hikes would continue, investors have been quick to buy and sell bonds, depending on the forecast du jour. The current low-vol run is just 17 days old, far below the median of 60 for the past half century.
 Volume Duration 10-Yr Treasury Yield
History suggests that the current period of relatively short, interrupted low-vol episodes is unusual and will soon give way to an extended episode of calm. That aligns with a number of forecasters who are predicting that the Fed’s rate hikes are nearly done.
Former Pimco chief economist Paul McCulley thinks economic headwinds will stay the Fed’s hand. He predicts “a pause and then a pivot [later this year].”
The market disagrees: Fed funds futures this morning are pricing in a roughly 76% probability that the central bank will lift rates by one-quarter point at the next FOMC meeting on May 3. But McCulley says the numbers ahead will change the calculus.
“They’re [Fed officials] going to look at the data coming in — recognizing that what’s going on with the stress in the banking system is going to work in tandem with what they’ve already done with 500 basis points worth of tightening almost,” he reasons.
 Enroll Here!