
Markets Start the Year on the Same Note as 2022 Ended — What Levels to Watch
US500
+1.68%
Add to/Remove from Watchlist
Add to Watchlist
Add Position
Position added successfully to:
Please name your holdings portfolio
Type:
BUY
SELL
Date:
Amount:
Price
Point Value:
Leverage:
1:1
1:10
1:25
1:50
1:100
1:200
1:400
1:500
1:1000
Commission:
Create New Watchlist
Create
Create a new holdings portfolio
Add
Create
+ Add another position
Close
DJI
+1.63%
Add to/Remove from Watchlist
Add to Watchlist
Add Position
Position added successfully to:
Please name your holdings portfolio
Type:
BUY
SELL
Date:
Amount:
Price
Point Value:
Leverage:
1:1
1:10
1:25
1:50
1:100
1:200
1:400
1:500
1:1000
Commission:
Create New Watchlist
Create
Create a new holdings portfolio
Add
Create
+ Add another position
Close
US2000
+2.04%
Add to/Remove from Watchlist
Add to Watchlist
Add Position
Position added successfully to:
Please name your holdings portfolio
Type:
BUY
SELL
Date:
Amount:
Price
Point Value:
Leverage:
1:1
1:10
1:25
1:50
1:100
1:200
1:400
1:500
1:1000
Commission:
Create New Watchlist
Create
Create a new holdings portfolio
Add
Create
+ Add another position
Close
IXIC
+1.76%
Add to/Remove from Watchlist
Add to Watchlist
Add Position
Position added successfully to:
Please name your holdings portfolio
Type:
BUY
SELL
Date:
Amount:
Price
Point Value:
Leverage:
1:1
1:10
1:25
1:50
1:100
1:200
1:400
1:500
1:1000
Commission:
Create New Watchlist
Create
Create a new holdings portfolio
Add
Create
+ Add another position
Close
The new year is well underway — and the market — well, it hasn’t done a whole lot since I last left it. People stopped believing in Santa, and market action remains slushy into the new year.
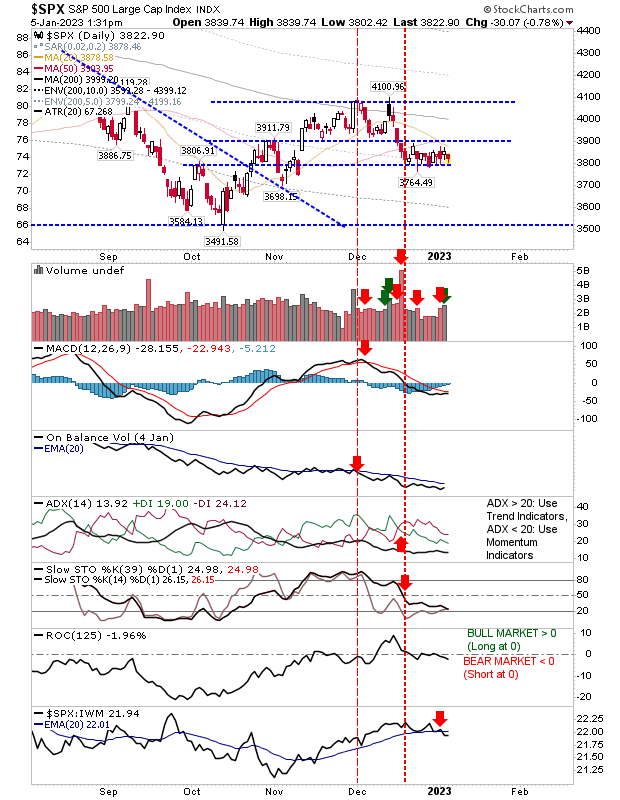
The S&P 500 is holding the support level defined back in the early October swing high. Volume has picked up on the slow return of traders as On-Balance-Volume continues to trend downwards. We have a switch back to the underperformance against the Russell 2000. Optimists might look to the upcoming MACD trigger ‘buy.’ At this stage, given the length of the consolidation and its compactness, it looks like one that will break lower.
 The Nasdaq Composite has its own consolidation, and although there is still a chance we have a bounce here, it’s going to have it to do from its own end-zone. Technicals are net bearish and not looking great. Optimists would look to heavily oversold conditions in stochastic momentum as a kickstart, but relative performance continues to degrade.
 Nasdaq Composite Daily Chart
The Russell 2000 consolidation has morphed into one comparable to the one in the S&P 500.
The one big difference is the new MACD trigger ‘buy’, plus it has the attraction of being the peer market leader.
 IWM Daily Chart
The most bullish setup is in the Dow Jones Industrial Average. Yes, we have a similar consolidation as the S&P 500 and Russell 2000, but this consolidation is running close to all-time highs and has the 50-day MA to assist in a bounce (following the mid-December `Golden Cross`). The MACD trigger ‘buy’ is close, but other technicals — stochastics in particular — are still disappointingly bearish.
 Dow Jones Industrial Average Daily Chart
The longer these consolidations last, the more likely they will break southwards. Having said that, there is a good chance for the Dow Jones Industrial Average or the Russell 2000 to lead out and bring the Nasdaq and S&P with them; but should either of the latter two indices crack lower, then it will be a long winter.


